This section describes how to create a composite, relationship or coalescent chart by combining two charts, or a group composite chart composed of up to 15 base charts.
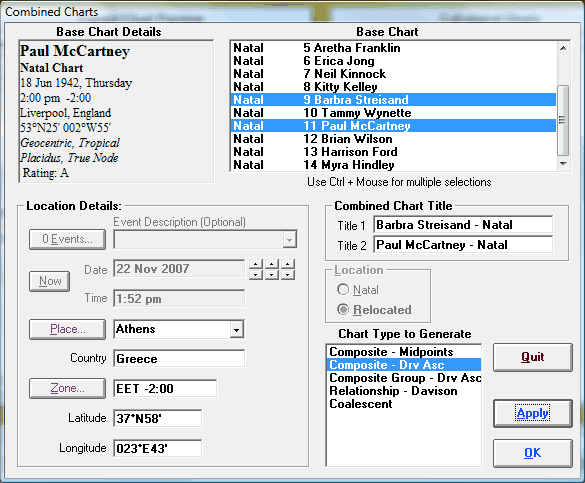
>> To cast a composite, Davison relationship or coalescent chart
1.Ensure that the natal type charts that you wish to combine are already calculated.
TIP: If you are just combining two charts, first select both charts you want to combine, then you can skip step 4 (nominating the charts to use).
2.Choose the Combined menu item from the Chart menu
3.Select the required chart type from the Chart Type to Generate list box.
4.Select two or more charts from the Base Chart list box. Holding down the Ctrl key allows multiple charts to be selected at once. You should only select two charts, unless you have selected the “Composite Group” chart type, in which case you may select up to 15 charts.
5.(Optional) Edit the Title1 and Title2 boxes. As charts are selected, these title boxes are automatically updated. When either one or two charts are selected, the title list boxes contain the chart name of each chart suffixed with its chart type. When more than two charts are selected then the Title1 box contains the last names of each selected chart, separated by slashes (/), and the Title2 box contains the chart type of the first selected chart on the list of base charts. These titles will appear whenever the chart is displayed or printed. These may be edited if you wish.
6.Select the Location type. If have selected the “Composite - Midpoints” or “Relationship - Davison” then this option will be disabled, and you can pass to the next step. Normally the combined chart is relocated to wherever the relationship exists.
•If the Natal option is selected then all the boxes relating to location, including time zone, longitude and latitude will contain the location details from the selected base chart, although only the latitude is used in the chart calculation.
•If you select the Relocated option, then all the boxes relating to location will contain the current default values, and you can enter new location data if you wish to. (See Saving and Restoring Settings for details on default values. See Casting a New Chart for instructions on how to alter location values).
7.If the Relocated option is selected then all the boxes relating to location, including time zone, longitude and latitude will contain the current default values. Any of these values may be altered in the same manner as when creating a new chart. .
8.Select either the Apply or OK button. The subsidiary chart will be calculated and added to the list of "Calculated Charts" in the list box on the Main Screen of the program. Use the OK button to close this dialog after the calculation. Use the Apply button to leave this dialog open to calculate further charts. After this dialog closes, you can view, print, report on, and otherwise manipulate the newly calculated charts.
Note - You cannot calculate a composite chart based on other composite charts. The mathematical basis on which composite charts are calculated does not work if composite charts are combined. The only way of combining more than two natal charts is to use the “Group Composite” method.